By Harold R.Chorney
Professor of Political economy,
Concordia University
Montréal, Québec
Preface:
More than twenty five years ago I began to write about problems of public finance.( Chorney, 1984) At the time that I began to do so, I never would have believed that Iwould still need to be writing a critique of fiscal conservative dogma almost twenty five years later !
The staying power of previously discredited bad ideas was much greater than I surmised at the time. The staying power of herd behaviour based on shallow derivative analysis was stronger than I understood. It was not for nothing that John Maynard Keynes once stated that if his revolution in economic thought were ever to be reversed it would be extraordinarily difficult to reinstate it. Not because he believed he was wrong, but because he knew that the forces of reaction and stubborn resistance to progressive economic thought were so deeply entrenched.
Sadly, he and Michal Kalecki who predicted that the Keynes breakthrough would be reversed once business became ‘’boom tired’’and there would be no shortage of economists to justify business’s anti-deficit spending prejudice were both very right about this.(See, M. Kalecki, Essays in Economic dynamics, The politics of the trade cycle; Kalecki was the Polish Jewish economist who ought to be considered the co-discoverer of Keynesian economics because of his essays on the investment process, unemployment and economic dynamics that he published in the early 1930s before Keynes’ General Theory which contained the essence of Keynes’ own argument. In addition as I shall show Kalecki also advocated the use of monetary policy to acquire debt during a deep slump in order to ensure that interest rates were kept as low as possible. )
He was eclipsed by Keynes , in part because he published his work in Polish, but also, of course, because Keynes was already a world famous economist because of being at Cambridge and having authored the Economic Consequences of the Peace which had made him world famous in 1920.Keynes to a small extent and certainly Joan Robinson later acknowledged the significance of Kalecki’s work.(See in particular,A.Asimakopulos, ‘’Kalecki and Robinson’’ in Mario Sebastiani, Kalecki’s Relevance Today, London: the Macmillan Press, 1989.See also Michael Kalecki, ”Political Aspects of Full employment, Political quarterly,Vol. 14, 1943, pp.322-331 reprinted in E.K.Hunt & Jesse Schwartz, eds. A Critique of Economic Theory, Harmondsworth:Penguin , 1972, pp.420-30.) Kalecki and Keynes both influenced Hyman Minsky who in a series of books and critical essays developed a model of financial instability and crisis tendencies in advanced financial capitalism that turned out to be incredibly accurate foreshadowings of the current crisis.( Hyman Minsky, John Maynard Keynes, N.Y.:Columbia University Press, 1975; Stabilizing an Unstable Economy, N.Y. McGraw Hill, 2008 0riginally published 1986; Can it Happen Again ? Essays in Instability and Finance, M.E.Sharpe, 1982; Simon Johnson and James Kwak,13 Bankers:The Wall Street Takeover and the Next Financial Meltdown, NYC; Vintage, 2010/2011. )
I first began to write about quantitative easing, which I called temporarily monetizing a greater portion of the debt in the early 1980s. I did so as part of research I did on behalf of leading Canadian public sector trade unions and a left of centre liberal social democratic think tank called the Canadian Centre for Policy Alternatives. As far as I know I was among the first, if not the first economist and policy specialist that advocated this approach apart from its original advocates back in the early 1930s, in the modern era.
I wrote several monographs and articles , presented the idea and the evidence before conferences of business economists and other academics and held public press conferences in Ottawa on Parliament Hill. But instead of the idea being accepted it was rejected and even denounced as reckless inflationary policy.At that time the idea and the policy recommendations that flowed from it were fiercely resisted by the Canadian central bank experts and Department of finance officials. Now more than twenty years later the idea has been welcomed in influential circles and celebrated as having helped the global economy from slipping into a deep and prolonged depression. What happened to change the reception. The policy clearly works. There is no evidence that it leads to inflation in the short to medium term as opposed to lower rates of interest and a faster economic recovery.
How have countries differed in their response to the crisis and their resort to this policy? Can we speak of a Kuhnian paradigm shift with respect both to the rediscovery of Keynes and the shift to quantitative easing I will begin to explore these questions in the paper.
Introduction:
The cataclysmic near total destruction of Wall street in the great crash of derivatives and the fraud ridden sub prime housing market in the 2008 slaughter on Wall street thoroughly frightened the world.
Joseph Stiglitz ,the Nobel prize winning economist who teaches at Columbia university, along with millions of his fellow Americans, had been sharply critical of the original form of US Treasury Secretary Paulson’s bailout plan. Undoubtedly his critique contributed to changes in the Bill which improved it considerably although I know he was still very critical of what had been signed into law. He was quite correct to insist that taxpayers’ interests needed to be better protected in a process which involved transferring toxic assets from private to public liabilities.
One of the ways that the final version of the Bill attempted to accomplish this was by approving in principle the notion of reverse auctions of the assets to be bought by the Treasury and provision for the Government to receive warrants exchangeable for equity in the firms that participate in selling assets to the Treasury. Hence, if the firm profited from the improvement in its balance sheet the taxpayer would as well. Some critics argued that these reverse auctions would be extremely difficult to conduct because of the heterogeneity of the assets involved and the difficulty in establishing their value. But so long as there was no collusion among the sellers of the assets the reverse auction process should have resulted in appropriate prices for the assets given the distressed state of the sellers.(Klemperer)
One of the risks in the Bill, however , was the provision for the alternative of firms purchasing Government sponsored insurance for their assets at rates that would cover the actuarial cost involved. To the extent that it was actually taken up it would have increased the average toxicity of the assets that were left over and instead sold to the Treasury.
Slough off the really bad stuff to the Government and insure the rest for a profit. Hence the provision for receiving equity was critical to protecting the public interest. The provision in the Bill for the Government and Congress to assess the program’s implementation after five years of operation and then to levy taxes on the financial services industry to cover shortfalls in the full recovery of costs should also have gone some way to further protect the taxpayers’ interests (see section 134 `Recoupment“ Emergency Economic stabilization Act 2008).
Subsequent events however changed Paulson’s approach.
The Crash and Panic in Detail
Over the three weeks (October 2- October 25, 2008) the collapse in stock markets became a frightening global phenomenon. On Friday October 24 th the markets dropped world wide by over 316 points in the US Dow Jones, by 9.6 % in the Nikkei index in Japan and by 4-5 % in Europe and substantially in China as well. The Dow Jones had fallen from its peak of 14,164 a year ago this October 10th to just over 8300, a fall of over 40 %– one of the larger drops in its history. By March of 2009 it had fallen to a low of 6600. Only the drops in 1919-1921, 1929-1932, 1937-38, 1939-1942, 1973-1974 were greater. The S and P 500 index in fact has suffered the second biggest slide in its history also falling by more than 42 %. The NASDAQ had fallen by 44.7 % over the past year and the Russell 2000 by 42.6 %.
Indices all over the world were down by between 33 and 71 %. These included Canada -32.8 %; Brazil-50.7; Mexico -42.5; Euro zone – 48.3; Switzerland -33.1; U.K. -39.9; Russia –71.1; Australia -39.0; China -65.8 Hong Kong -54.6; Japan -50.0 ; Singapore -53.8; South Korea -50.5; Taiwan -46.2. From October 26 to November 13th the market fluctuated wildly culminating on November 13 th with a swing of 900 points in one day from a new bottom of about 7800 on the DOW to a close of just over 8800.
The very next day however the market opened with a downturn suggesting that volatility and a sense of no clear direction remained the key characteristic as more bad economic news was released with deepening recessions in the U.K., Germany and the U.S. leading the way.
Oil had also fallen from its year ago cash spot price of 91.87 to a low of about $54 for West Texas Intermediate on the cash spot market. On the futures market it had peaked at $147 but it had now fallen to $56 on NYMEX.( Its January 2009 price was as low as $37. This month the price of NYMEX oil is once again above 100 $ a barrel as instability in the Middle East accompanying the Arab revolution has led to considerable nervousness in the futures and spot markets.)
OPEC cut its production quotas during this earlier period but prices still fell. Almost all of the other leading commodities had also fallen in price including copper, aluminum, platimum, lead, steel, tin , zinc coffee, wheat, corn , sugar, cheese , milk, corn oil and soybean oil. In the past 12 months they have recovered substantially.
Over the past 118 years there have been 100 episodes in which the Dow lost 10 % or more over the highest previous close in the previous 30 days. Of these, in 45 cases the Dow was higher three months later. In a number of cases there were longish bear markets that followed and in three cases 1907, 1929 and 1973 these depressed markets lasted several years . The August 1929 peak was only regained in November 1954.(Niederhoffer, pp.42-43)The 1973 peak in 1979 and the 1907 peak in 1910.
Markets world wide experienced similar dramatic losses and the paralysis of the banking sector had worsened despite passage of the Bill. To combat this the Treasury then implemented the provisions of the Bill which permitted taking share ownership in return for injecting new capital.
In this respect they were influenced by the approach of the British Labour government led by Gordon Brown which announced it was injecting 37 billion pounds into RBS, Lloyds and HBOS in return for equity in order to prevent their collapse.(New York Times , October 8, Guardian October 13,2008). In return the Banks agreed to help prevent foreclosures and executives agreed to limitations on bonuses and compensation packages. The British government ended up owning 43.5 % of the Lloyds HBOS group and 60 % of the RBS. It also made 6.5 billion pounds available to Barclays should they decide to take it up. Barclays however refused the offer.
George Soros also had suggested a variant of the British plan in an article in the Financial Times(October 12, 2008) which involved injecting both public and private capital into the banks in return for preferred shares. These measures of course, diluted the current shareholders’ common stock and entailed further losses but in the longer run helped rescue the banks from collapse. At the same time European leaders announced that were going to guarantee inter bank lending in what should eventually turn out to be a successful effort to unlock the credit markets. Germany set aside 80 billion euros to recapitalise its banks and France 40 billion euros. In addition the European central bank, the Bank of England and the Swiss central bank offered their commercial banks unlimited swap loans of varying maturities and large quantities denominated in dollars in exchange for appropriate assets. All of these measures introduced substantial new liquidity into the financial system. If one totals up the European programs the total money involved was close to 2 trillion US dollars.
The US under the TARP was injecting up to $ 245 billion into American banks with the largest 8 banks receiving a total of $ 125 billion. The banks received the capital and the Government took preferred shares in exchange and guaranteed senior debt for 3 years. The FDIC insured all non interest bearing accounts which were primarily used by business.
The biggest banks received the money as follows: Bank of America $25 billion; Citigroup 25 billion; JP Morgan Chase 25 billion; Wells Fargo 25 billion; Goldman Sachs 10 billion; Morgan Stanley 10 billion; Bank of New York 2-3 billion; and State Street 2-3 billion. Most of these banks have now returned the money with interest and the government has sold the shares they acquired for a profit. In fact, in the latest TARP report this month it is predicted that TARP’s aid to the Banks will turn a 20 billion dollar profit. Out of 245 billion advanced some 243 billion has now been returned. The total TARP program which also aided the auto companies and AIG insurance in addition to the banks paid out a total of 410 billion and so far has returned 274 billion with a final cost estimated to be 28 billion. It is possibly true that a different approach would have yielded far greater profits to the taxpayer, increased the flow of funds through the economy, permitted greater future reform, and prevented some of the excessive bonuses that were paid out as Stiglitz and other critics have argued. Nevertheless, the fact is that TARP cost a fraction of what it originally was expected to and on the whole it worked to save the financial system and therefore the American economy from complete collapse, albeit imperfectly.
The American and British action in fact represented a partial temporary nationalization of banks and the goal was to unlock the credit markets and restore the proper functioning of the banking system . None of the governments was willing to say that their actions constituted defacto nationalization but in fact that is what they were doing, albeit temporarily in an emergency. The British government stated it had no intention of hanging on to the Banks for long but time will tell. It also reveals just how serious the crisis had become. The American action was also be time limited with the clear intention of returning the banks to private ownership as soon as conditions had stabilized and the Government can recover its investments.
The problem in 2008 and 2009 and to some extent 2010 still appeared to be despite these massive infusions of cash that no one trusted anyone else as to their counter party risk exposure. As a consequence the banks appeared to be using the infusions not to unblock the credit and loan system but rather hoarding the cash, to improve their balance sheets and possibly for takeover acquisitions, while tightening credit to reflect the then current head for the hills market sentiment. They also angered the public understandably when they appeared to use the money to pay out huge bonuses to their senior management. This required further intervention by the American Government and governments in other countries facing similar problems to insist that the banks use the money for the purposes intended.
In effect we had the outcome that Keynes foresaw in The Treatise on Money in his chapter on fluctuations in the rate of investment and his discussion of the role of liquid capital (Vol 2,bk.vi,chapter 27, pp.96 ff; also ch.30 bk.vi vol2,p.203)) in which he argued that disproportionalities in the savings and investment functions would lead to co-ordination problems in the economy and that excessive liquidity preference by the banks themselves could lead to inadequate investment and too high a rate of interest prevailing in inter-bank lending during a slump. borrowing from Wicksell he observed that the market rate of interest could be very sticky in comparison to the natural rate of interest and result in divergences between savings and investment.(Keynes, Treatise,vol.2 bk vi, ch.30 p.2o3 ); See also the discussion of this in Minsky, Keynes, Stabilizing;A.Leijonhufvud, On Keynesian economics and the Economics of Keynes ;)This is precisely the situation we faced over the past three years and the great challenge will be to get the banks to lend again at reasonable rates of interest.
As of November 13th 2008 the Treasury Secretary Henry Paulson announced that he was abandoning his plan to acquire toxic assets from the banks and instead was shifting his focus to use TARP funds to inject capital into the asset backed commercial paper markets that are linked to car loans, student loans and credit card debt. The government also announced on November 9th that it was increasing its injection of funds into AIG insurance by some $ 40 billion in order to reduce the burden of interest on previous loans to the company. The government injected some $152 billion into AIG through a combination of low interest loans, purchase of preferred shares and the establishment of a funded entity to offload and resell bad debt.
Great Britain has already ordered that its banks use the funds advanced to them to unlock their credit markets. Paulson’s decision to refocus his attention on the non bank consumer oriented financial markets was a way of putting pressure on the banks to do so. By having refused to do so despite the advances made to them the banks will now have to accept lower prices for their toxic debt than what they would have been able to wring from the Treasury and their bargaining power is now reduced.(New York Times, October 25, 2008 When will the banks start making loans? ) Despite all these measures the indicators in 2008 and 2009 still pointed to falling prices, failing firms and increasing job layoffs. The turnaround in growth did not come until the summer of 2009 and the turn around in employment has only just begun to materialize in the end of 2010.
It is of course one of the structural weaknesses of monetary policy pointed out by Keynes and admitted to by D.H.Robertson that `the banking system may be hard put to make the money supply large enough, and keep it moving fast enough , to check the fall in prices ” in a crash or depression. (D.H.Robertson, Money, p.177) That is why in addition to these financial infusions there is a need for additional fiscal stimulus.
The central banks’ Response
In March 2009 working in concert with the U.S. Federal reserve the Governor of the Bank of England Mervyn King announced that the Bank would embark upon its own program of quantitative easing. It intended to inject 75 million pounds of additional money supply by buying up financial assets from the private sector. by doing so it hoped to keep the downward pressure on interest rates which it had already lowered to 0.5 % and increase liquidity, the money stock and thereby support aggregate demand. Mervyn King the Governor explained the move in detail in an interview with the B.B.C. on March 5, 2009. (See http://www.bankofengland.co.uk/monetarypolicy/assetpurchases_stream.htm
htm.) King specifically rejected the idea raised by the interviewer that such a move risked serious inflation. As he put it there is virtually no risk of Weimar style hyperinflationresulting from these measures.
”we’re not going to see the rapid rates of inflation that you describe and are associated with episodes of hyperinflation, but we do need to do something now to increase the supply of money to ensure that growth and inflation return to normal levels. That’s what we’re going to do.”
He was of course right. In fact, he explained as I had tried to do so more than 2 decades earlier that this action was simply an extension of what the Bank did normally in its interventions in the money market of buying and selling debt in order to establish a specific interest rate in the market.King also promised to increase the amount of QE should conditions warrant.
”What we’re trying to do is to increase the supply of money in the economy. Normally, it grows at a healthy, positive rate to support growth, keep inflation close to our target. Since last year, the increase in the supply of money has fallen; it’s basically flat now. Money is not growing quickly enough to support economic growth. Normally, we cut interest rates in order to boost the supply of money. We’ve done that; it has helped, but we need to go further. What we’ve announced today are measures to increase the supply of money injected directly into the wider economy.”
As King explained the measures seemed strange simply because the problem of deflation and a shrinking money supply had not been a problem for over 40 years so people were unfamiliar with the appropriate remedies.
”We do intervene in the money markets all the time in order, normally, to keep the interest rate close to our target. What we’re now doing is to try to increase the supply of money in the economy directly rather than going through the banking system. That means the amounts of money will seem rather large, but we’re swapping, here, money for financial assets that we’re buying from the private economy. I think this is a perfectly responsible and sensible thing to do. Remember that what we’re trying to do is we’re not worrying here about an economy where the amount of money is growing too quickly. That has been the case for much of the past 40 years, which is why what we’re doing today seems unfamiliar, because the problem in the past has usually been that the supply of money was growing too quickly and we had to keep inflation down. We’re facing the opposite situation right now. After this extraordinary downturn in the world economy, the crisis in the financial sector, the amount of money in the economy is not growing quickly enough. What we’re trying to do is to ensure that it grows quickly enough to ensure we see the beginning of an economic recovery and to keep inflation close to our 2% target, but not so quickly that we see inflation pick up above that.”
He was of course right. In fact, he explained as I had tried to do so more than 2 decades earlier that this action was simply an extension of what the Bank did normally in its interventions in the money market of buying and selling debt in order to establish a specific interest rate in the market.
In the United States Federal Reserve chairman Ben Bernanke announced on March 19, 2009 that it would through quantitative easing expand its balance sheet while keeping the federal funds rate at 0 to 1/4 % by purchasing up to an additional 750 billion dollars of mortgage backed securities to bring its total to 1.25 trillion and increase purchases of agency debt by 100 billion to bring its total to 200 billion for 2009 as well as purchase up to 300 billion dollars of longer term treasury securities. In November of 2010 the Fed announced a second phase of its QE operations by announcing that it intended to purchase up to an additional 600 billion dollars of U.S. Treasury bonds.
The European Central Bank by far the most rigid monetarist bank was reluctant to embark on the QE course but it did so in a modest fashion in 2008 by expanding its list of acceptable assets that the commercial banks could pledge as collateral in return for euros. On May 7 2009 it announced it had cut its interest rate to 1 % and would buy 60 billion euros in covered bonds . For an economy the size of the euro zone this was a very small amount and it was only adopted after considerable debate ,argument and disagreement among the ECB board of governor’s (Ambrose Evans-Pritchard, European central bank falls into line and embraces quantitative easingMay 7, 2009
Daily Telegraph,
http://www.telegraph.co.uk/finance/financialcrisis/5292781/European-Central Bank, consulted March 27,2011)
The Bank of Canada, also a fairly rigid monetarist leaning central bank that I have disagreed with for decades was also reluctant to fully embrace the policy, characterizing it as a policy fit for special emergencies.In April of 2009 the Bank released its monetary policy report in which it announced that it had lowered its target for overnight interest rates to 1/4 of one % and expected that rate to remain there until the end of the second quarter of 2010. The bank stated ”Additional stimulus could be provided, if needed , through quantitative and /or credit easing.It defined the policy of quantitative easing as follows: QE refers to outright purchase of financial assets through the creation of excess settlement balances(that is central bank reserves) these asset purchases will push up the price and reduce the yield on, the purchased assets(which could include government securities or private assets.the expansion of the amount of of settlement balances available to direct participants in the Large Value transfer system would encourage them to acquire assets or increase the supply of credit to households and businesses.This would increase the supply of deposits
(or monetary aggregates) and further increase the demand for other financial assets pushing their price up and their yields down. central bank purchase of treasury bills and short term government bonds would also help reinforce the impact of the conditional statements about the future policy rates.(Bank of Canada, Monetary policy report, Framework for conducting monetary policy at low interest rates, April 21, 2009;
http://www.bank-banque-canada.ca/enmpr/pdf/2009/mpr230409.pdf; consulted March 27,2011) the Bank of canada also indicated that an exit strategy would entail unwinding the Bank’s various facilities and acquisition of assets and would be guided by conditions in the creditmarkets and the inflation outlook.Various alternatives would be available including a natural runoff involving maturing assets, refinancing of acquired assets and gradual assets sales at an appropriate measured pace.(Bank of Canada, monetary policy report) in the end however consistent with its more rigid approach and in the light of the fact that recession was less severe in Canada than the U.S the Bank relied on low interest rates alone to support the economy and left QE to the Americans.
Finally the Bank of Japan which originated this approach way back in the early 1930s also participated in drawing on QE to fight back against the deflationary depression that threatened the global economy.In 2006 it had ended its policy of QE and zero interest rates that it had used to fight the decade long deflation in Japan that had followed the bursting of its housing bubble at the end of the last millenium.It had greatly expanded its balance sheet so that at its peak reserves had reached 35,000bn Yen.Some analysts(see for example,John Richards in the FT, Dec.17, 2008 Quantitative Easing lessons from Japan,consulted March 27,2011) blogs.ft.com/economistsforum/2008/12/12/quantitative- easing-lessons claim that the prolonged period of QE led to bubble in bonds which when it burst in 2003 led to a steeply rising yield curve.
But in March 2009 the BOJ announced plans to increase quantitative easing including the purchase of government bonds as well as bank debt and corporate and commercial paper. they supplemented this original announcement with subsequent announcements in 2010 on October 5 committing to buy up to 5000bn yen($60bn US) in financial assets; this was further expanded in March of 2011 by an announcement that they would buy 15 trillion yen or $183 bn and they will greatly expand their asset purchase fund for government securities. According to a Bloomberg news report the BOJ would increase its buying of short term government securities by 1 trillion yen and government debt by 500 billion yen as well as increase the purchase of corporate debt, ETFs and Real Estate investment trusts. March 14, 2011, Bloomberg news.)
So if we sum up these various efforts it is quite clear that in the five economies that represent more than 55% of the global economy quantitative easing has played a major role in monetary policy used to fight the downturn.More than 2 trillion U.S. dollars had been injected into global money supply by the technique. This is a relatively small amount when we consider the more than 74 trillion dollar size of the global economy and the size of the global money stock at about 45 trillion for M2, but it is still a significant amount and on the whole it has prevented bond market blackmail.The ratio of the addition of monetized debt to the broadly defined money stock is of the order 5 % and remains well within safe limits from the point of view of generating inflation. Overall the global central banking system slashed their interest rates and in certain cases expanded their money supply through quantitative easing.The reduction in interest rates is clear from the following table developed by the Reserve Central Bank of Australia and printed in a speech by the deputy governor in May of 2009.
Change from 1 Jan
to 1 Sep 08
(basis points)
Change from 1 Sep
08 to present
(basis points)
Current level
(per cent)
Developed marketsUnited StatesEuro areaJapanUnited KingdomCanadaAustraliaSwedenSwitzerlandNorwayDenmarkNew ZealandEmerging AsiaChinaSouth KoreaIndiaTaiwanIndonesiaThailandHong KongMalaysiaPakistan*PhilippinesEmerging EuropeRussia**TurkeyPolandCzech RepublicRomaniaLatin AmericaBrazilMexicoChileColombiaPeruOtherSaudi ArabiaSouth AfricaIsraelIceland***
Table 1: Changes in Monetary Policy
* After raising its policy rate by 200 basis points in November 2008, Pakistan’s central bank lowered its policy rate by 100 basis points in April 2009.
** Russia’s central bank increased its policy rate by a cumulative 200 basis points during November 2008 in moves aimed at stemming capital outflows and mitigating the downward pressure on the ruble.
*** After initially lowering rates by 350 basis points in mid October 2008, the Icelandic central bank increased its policy rate by 600 basis points two weeks later as part of the conditions of the IMF’s rescue package. Subsequent easings have amounted to 500 basis points.
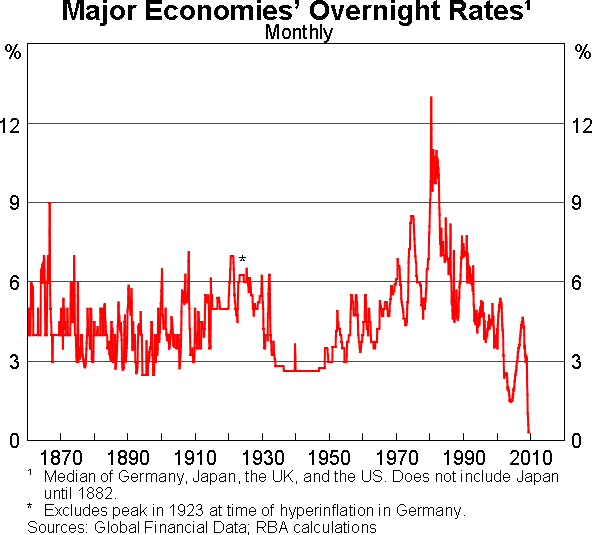
Sources: Bloomberg; central banks this reduction in interest rates to historic lows is also clear from the chart below which shows ovrnight interest rates for the major economies of Germany, Japan, the U.K. and the U.S. from 1870 to 2010. |
| ↓ |
225 |
↓ |
188 |
0.125 |
| ↑ |
25 |
↓ |
325 |
1.00 |
|
0 |
↓ |
40 |
0.10 |
| ↓ |
50 |
↓ |
450 |
0.50 |
| ↓ |
125 |
↓ |
275 |
0.25 |
| ↑ |
50 |
↓ |
425 |
3.00 |
| ↑ |
50 |
↓ |
400 |
0.50 |
|
0 |
↓ |
250 |
0.25 |
| ↑ |
50 |
↓ |
425 |
1.50 |
| ↑ |
35 |
↓ |
295 |
1.65 |
| ↓ |
25 |
↓ |
550 |
2.50 |
|
0 |
↓ |
216 |
5.31 |
| ↑ |
25 |
↓ |
325 |
2.00 |
| ↑ |
125 |
↓ |
425 |
4.75 |
| ↑ |
25 |
↓ |
238 |
1.25 |
| ↑ |
100 |
↓ |
175 |
7.25 |
| ↑ |
50 |
↓ |
250 |
1.25 |
| ↓ |
225 |
↓ |
300 |
0.50 |
|
0 |
↓ |
150 |
2.00 |
| ↑ |
300 |
↑ |
100 |
14.00 |
| ↑ |
75 |
↓ |
150 |
4.50 |
| ↑ |
100 |
↑ |
100 |
12.00 |
| ↑ |
100 |
↓ |
750 |
9.25 |
| ↑ |
100 |
↓ |
225 |
3.75 |
|
0 |
↓ |
200 |
1.50 |
| ↑ |
275 |
↓ |
75 |
9.50 |
| ↑ |
175 |
↓ |
275 |
10.25 |
| ↑ |
75 |
↓ |
300 |
5.25 |
| ↑ |
175 |
↓ |
650 |
1.25 |
| ↑ |
50 |
↓ |
400 |
6.00 |
| ↑ |
125 |
↓ |
225 |
4.00 |
|
0 |
↓ |
350 |
2.00 |
| ↑ |
100 |
↓ |
350 |
8.50 |
|
0 |
↓ |
375 |
0.05 |
| ↑ |
175 |
↓ |
250 |
13.00 |
The unusual period of monetary policy began in September 2008, after the failure of Lehman Brothers dramatically escalated the financial crisis. This in turn led to a collapse of household and business confidence around the world. Official interest rates have since been cut very sharply across virtually all countries due to the highly synchronised nature of the current economic cycle. The average reduction in interest rates has been 330 basis points in the developed economies and about 300 basis points in emerging economies. Among the developed economies, only four – Australia, New Zealand, Denmark and Norway – still have official interest rates above 1 per cent. Official interest rates have never been this low in the developed world in the 150-year period for which we have data (Graph 1).
The end of deregulation and laissez-faire
Nationalizing banks, even partially and temporarily still takes us back to the days of FDR. It is a long way from rational markets theory and the philosophy of laissez-faire. There is no going back in the near future or even medium term to the economics of deregulation and laissez-faire capitalism after this. No less a free markets advocate than Alan Greenspan has admitted that his deregulation ideology was flawed and that he was shocked and in a state of disbelief by the failure of banks and financial institutions to properly self regulate the derivatives market and protect shareholders’ interests. (House testimony) No one for many years to come will one be able to credibly argue for deregulation of the financial markets and laissez-faire knows best after these cataclysmic and paradigm shifting events.
Instead of rational markets we were confronted with a global market crash and a financial system that was perilously close to complete paralysis and failure. One of my colleagues has suggested that the markets did behave rationally by panicking and seeking to sell off equities that it viewed as horribly overvalued because of their exposure to the derivatives fiasco.
But this is disingenuous because of the origins of the derivatives crisis itself in the absence of market regulation. Laissez-faire obsession accompanied by excessive greed played a major role in unleashing this crisis.
But whatever its origins it developed very swiftly into a once or twice in a century financial panic along the lines of the 1873 banking panic that was also based on a housing bubble, the 1907 collapse that was rescued by the joint intervention of the Government and J.P.Morgan and the collapse of the markets in 1929 and 1930 which ushered in the Great Depression. Some analysts on the left, such as, for example, Dean Baker(see the Guardian, October 3, 2008) as well as some on the right had insisted that President Bush, Hank Paulson and Ben Bernanke the Chairman of the Federal Reserve, who had warned of the risk of this crisis being as grave, were exaggerating the problem in order to advance their own special interests or agenda .
Recent events in the markets suggested otherwise. Prominent market analysts like George Soros, Robert Schiller and Warren Buffett had been suggesting the possibility of an event of this magnitude long before President Bush spoke of it. Hyman Minsky suggested that it was a possibility two decades ago. The freezing up of the inter-bank loan market and the withdrawal of funds from the stock markets was already underway before President Bush warned of dire consequences .
Panics, Crashes and Manias
Anyone who has studied or carefully observed the behaviour of mass society in the post-modern age knows that panics, crashes and irrational manias are an integral part of contemporary culture and an important aspect of the history of capitalism. Kindleberger, Minsky and Galbraith have all shown in their own work just how powerful these kinds of destructive forces were in the past. There is not much of a leap from tulip bulbs, the South Sea bubble John Law and Mississippi swamp land to grossly inflated land values and overpriced cottages and houses and arcane derivatives that exploit lack of transparency to mask fraudulent overleveraged pricing. The irrational aspect of human nature and tendency to panic is a constant. Bernie Madoff was not the first person to operate a Ponzi scheme though his was certainly one of the more outrageous ones.
This aspect of human nature has been magnified and accelerated in the contemporary world. As John Koning a Toronto economist and investment dealer who writes from an Austrian perspective has pointed out, the panics of the past are incorporated into the collective memory and they hence make it more likely for mass psychology to follow a familiar pattern.(See also Niederhoffer,McKay and Kindleberger) In the post modern world of click and Blackberry culture and fleeting attention spans that typifies our world it is not a surprise to witness a financial panic that accelerates at a fearsome pace. An updated and effective regulatory framework will need to keep this in mind.
It will take time and considerable effort on a broad range of fronts to re-establish some stability and the absence of panic.
The U.S. Financial Crisis Inquiry Commission Report into the financial collapse released this January 2011 made it clear that the fault could be widely distributed and that the result was avoidable if better ethics, greater transparency and more perceptive regulation had prevailed. Their report is worth reading because it throws considerable light on run up to the crash in terms of the bad practices and reckless behaviour of the investment banks, the mortgage institutions, the rating agencies and the negligence of the regulatory institutions. The commission heard 700 witnesses over 19 days of public hearings and explored in depth what they called ‘the greatest financial crisis since the Great Depression”. It is worth quoting several passages from the Report.
As this Report goes to print, there are more than 26 million Americans who are out of work, cannot find full time work, or have given up looking for work. About 4 million families have lost their homes to foreclosure and another 4 ½ million have slipped into the foreclosure process or are seriously behind in their mortgage payments. Nearly 11 trillion in household wealth has vanished with retirement accounts and life savings swept away. Businesses large and small have felt the sting of a deep recession…
It was the collapse of the housing bubble fueled by low rates of interest ,easy and available credit, scant regulation and toxic mortgages that was the spark that ignited a string of events which led to a full blown crisis in the fall of 2008 and trillions of dollars in risky mortgages and mortgage related securities were packaged and repackaged and sold to investors around the world. When the bubble burst hundreds of billions of dollars in losses in mortgages and mortgage related securities shook markets as well as financial institutions that had significant exposure to these mortgages and borrowed heavily against them. This happened not just in the U.S. but around the world.
Derivatives of an increasingly esoteric nature CDOs, CDO squared, synthetic CDOs and Credit default swaps flooded the financial markets and dramatically increased the risk exposure of the investment banks, AIG insurance and retail investors. The report makes clear that there had been a dramatic increase in the size and opaqueness of the financial industry since the 1980s. From 1987 to 2007 debt held by the financial sector rose from 3 trillion to 36 trillion, doubling as a proportion of the GDP.
In 2005 the ten largest U.S. banks held 55 %of industrial assets, twice their 1990 levels. In 2006 financial sector profits equaled 27 % of all corporate profits in the U.S., up from 15% in 1980. So the Report concludes that the financial sector had expanded excessively, transparency had decreased and reckless risk taking using products that were not well understood had multiplied. Leverage was as high as 75 to one in the case of Fannie Mae and Freddie Mac and 40 to one in the case of Lehman brothers. In addition the institutions were raising their billions of dollars in funds in short term daily loans thereby greatly exacerbating the risks. The risky exposure of the banks was often hidden in off balance sheet items, derivatives and window dressed up financial reports.
But in the face of all of this the regulators were wrongly complacent about the dangers. They are sharply critical of the rating agencies for having granted triple A status to many products that did not deserve them. Moodys, for example had approved 1000s of packages with this status which subsequently were downgraded. Whereas in the past AAA was rarely granted it had become commonplace. The regulators also are criticized for their complacency in the face of these developments and their failure to anticipate the obvious dangers of the changes in the system. Officials like Bernanke and Paulson are criticized for underestimating the consequences of the mortgage crisis. They accuse the government of being ill prepared and acting inconsistently when the crisis struck thereby increasing uncertainty and panic. They point out that there is considerable evidence that the lobbying efforts of the industry had led to the capture of the regulators by those being regulated.
From their perspective there is plenty of blame all around:
From the speculators who flipped houses, to mortgage banks who scouted loans, to banks who issued mortgages, to financial firms that created the mortgage backed securities, collateralized debt obligations, CDOs, CDOs squared and synthetic CDOs, no one in this pipeline of toxic mortgages had enough skin in the game . They all believed they could offload their risks on a moment’s notice- They were wrong. When borrowers stopped making payments, the losses, amplified by derivatives rushed through the system. (p.xxiv)
Just prior to the inauguration of the Obama administration I wrote as follows about the tasks that lay ahead.
The immediate priority of the new Obama Government in Washington next January will have to be a reassessment of the legislation to fix whatever gaps still exist in it; a restructuring of the American auto industry; a massive fiscal stimulus perhaps as much as $500 billion that targets neglected infrastructure and creating jobs for low and moderate income people; programs to aid the poor, the homeless and those who are facing unemployment; repair and reform of the health care system to bring it up to a modern standard for an advanced capitalist country; and aid along the line that Stiglitz proposes for those who are facing foreclosure. The last is partly mandated by the Bill that has just been passed but undoubtedly will need improvement.
Here one can use a housing stabilization fund (HSF)or relevant portions of the TARP that relieves burdened homeowners of part of the mortgage and renegotiates the terms so that the liability for the relieved portion is shared between the original mortgagee and the HSF. In return for this aid the homeowner assigns an appropriate portion of any future capital gain to the HSF.
I first developed a scheme like this more than thirty years ago when I was a government housing economist in Manitoba and was tasked with developing a scheme to prevent the benefits of a government land assembly from being totally captured by the first buyer of the property as opposed to being passed on to future buyers in perpetuity.(see my blog haroldchorneypoliticaleconomist.piczo.com April 7, 2008)Soros and others have proposed variants of this scheme in recent articles.
Although the deficit is being increased by these measures it is important to keep things in historical perspective. A one trillion dollar increase in the deficit adds about seven percentage points to the deficit to GDP ratio. So if a $500 billion fiscal stimulus were added to, say, a $500 billion dollar capital injection and the rescue of some toxic assets over the next two years(I am assuming that some assets will be insured rather than bought by TARP. Some will also be bought by private market actors. Some will also turn profitable over time) on top of about $300 billion for Freddie Mac, Fannie Mae and Bear Stearns and AIG the resulting deficit to GDP ratio would be significant , above 10 % of the GDP. During the Second World War the deficit soared to as high as 30 % of the GDP in 1943. It was above 20 % in 1944 and 1945.
At the moment financing costs are very low because of the enormous demand for quality government debt. The proportion of the debt held by the Fed is low, about 6 % as a proportion of the GDP as compared to 10.7 % in 1946.With careful management by the Federal Reserve including its intervening to keep the financing costs minimal through the purchase and resale of these assets there is no reason for the increase in the debt to cause any sort of alarm.
In 2006 the net debt (that is gross debt minus debt held by Federal Government accounts) to GDP ratio for the US was quite manageable, under 38 % of the GDP. (See Table 7.1 in The budget for fiscal year 2008, pp126-127.)
Even after expanding it to accomplish these goals it will still be very manageable, close to 50 % of the GDP.
As calm gradually returns to American and global financial markets which will take some time, the harrowing events of these past years will enter the history books as another powerful example of the limits of laissez faire and the necessity of countervailing regulation and a progressive state that uses Keynes style technique in order to bring humanist reason to bear on the extraordinary destructive but also potentially extraordinary creative power of advanced capitalism in the age of globalization.
We can now look back at this period and see that I was correct about a number of things, wrong about others including underestimating somewhat the size of the stimulus that was necessary and the ferocious anti Keynesian response of the fiscal conservatives who have shown amazing resilience in reawakening deficit hysteria.
Although as I write in the spring and early summer of 2010 and winter of 2011 ,circumstances are significantly improved and much but not all of the fears of another great depression have dissipated. In many respects we have not seen something as dramatic since 1929. Alan Meltzer in the Wall Street Journal(‘’What Happened to the ‘Depression’’’ Wall Street Journal Aug.31, 2009 )disputed this comparison of the crash and the subsequent deep slump as the worst crisis since the depression of 1929 ,but I don’t find Meltzer completely convincing, although I am an admirer of his outstanding History of the Federal Reserve(Allan Meltzer,A History of the Federal Reserve, Vol.1:1919-1951 , Chicago: University of Chicago Press, 2003, 800 pages; see also,Barry Eichengreen and Kevin O’Rourke , A tale of two depressions :What do the new data tell us ?:
http://www.voxeu.org/index.php?q=node )
It is true that two years and a half years later we find that unemployment is still 9.0 % as compared to 20 % in the great depression; the slump in U.S. GDP is 3.5 % versus the over 20 % fall in 1930; and the technical end of the recession in terms of the resumption of positive growth this time is 18 months in the U.S. versus over 3.5 years in 1929-1933.
But these results are only after the most massive and co-ordinated monetary and fiscal stimulus since world war two. Furthermore, no other recession since the thirties involved a more widespread and systemic crisis in the financial sector which was of a global nature.
When we add up these factors it is clear that the crisis as it appeared in the fall of 2008 was the worst since the great depression. (On the financial crisis and its roots in the sub prime housing market, Ponzi finance and the derivatives created on this market see among others: Henry M.Paulson,Jr. On The Brink, Inside the Race to Stop the Collapse of the Global Financial System, N.Y. :Business plus, 2010; Scott Patterson, The Quants:How a New Breed of Math Whizzes Conquered Wall Street and Nearly Destroyed It, N.Y.: Crown Business, 2010; Joseph Stiglitz, Freefall:Free Markets and the Sinking of the Global Economy , N.Y.,Allen Lane, 2010; William Cohan; House of Cards:A Tale of Wretched Excess on Wall Street,N.Y.:Random House Doubleday, 2009; Benoit Mandelbrot & Richard Hudson, The Misbehaviour of Markets:A Fractal View of Financial turbulence, N.Y.:Basic Books, 2004; Kevin Phillips, Bad Money:Reckless Finance, failed politics, and the Global Crisis of American Capitalism, N.Y.:Viking, 2008; Haroldchorneypoliticaleconomist.piczo.com; Nouriel Roubini & Stephen Mihm, Crisis Economics:A crash course in the future of finance, N.Y.&London: the Penguin Press, 2010; Paul Jorion, La Crise:Des subprimes au seisime financier planétaire,Paris, France: Fayard, 2008; Richard Posner, A failure of Capitalism:The crisis of 08 and the descent into depression, Cambridge, Mass. and London U.K., 2009; Bill Bamber & Andrew Spencer,Bear Trap: The Fall of Bear Stearns and the Panic of 2008, New York :Brick Tower Press, 2008; Richard Bookstaber,A Demon of Our Own Design: Markets, Hedge funds and the Perils of Financial Innovation,Hoboken N.J., John Wiley & sons, 2007 )
The mood in the world’s financial capitals has been uniformly cautious but slightly upbeat as the stock market has boomed since its nadir in March of 2009. At that point, the Dow had fallen to the 6600 range from its August 2007 high of 14147.
In February, 2011 as I wrote this it had a value of just over 12,000. The events in the Middle East have knocked it down several 100 points from its previous recovery high point. Some investment analyst are becoming nervous about another major fall in values since price to earnings ratios have steadily risen above accepted norms, but many remain bullish.
Robert Schiller has shown that before the crash, price to earnings ratios were at the highest they had been in more than fifty years and hence he correctly anticipated a crash once the bubble burst. (See the Yale University You tube video, A panel discussion on the national financial crisis, April 14, 2009 with Robert Shiller, Jean Geanakoplos, Frederick Beinecke and Richard Levin.April 14, 2008.
http://www.youtube.com/watch?v=ilApxQjhs_s) In late May the stock market jitters had driven the Dow once again below 10,000 but it quickly rallied to 10,130 on May 26, 2010. On
February 23, 2011 it sat at Dow 12,050.But after the Japanese earthquake and tsunami and nuclear power plant crisis the market has dropped to the 11,644 range.
It was impossible to predict accurately with complete confidence what would happen in the coming months. Canada, for one, had been experiencing robust growth of 6.1 % in its first quarter 2010 GDP and a strong dollar at that time. The dollar had reached parity and above but then slipped back to 94-96 cents U.S.At the time it strengthened and was then above parity with the U.S. dollar trading at 101.6.It subsequently weakened considerably as oil prices fell and NAFTA came under attack.Currently it trades in the 75-77 cent range against the American dollar.
But unemployment in Canada, although lower than in the U.S. was still high at 7.8 %. In Montréal, for example unemployment was above 9 % and in certain categories, like 16- 25 years of age it reached over 20 %. If growth continues at the current rate, however, it seemed clear unemployment slowly should begin to fall substantially. Unfortunately, the Bank of Canada chose to raise interest rates by 25 basis points on June 1, 2010. This then was followed by small but significant rises in mortgage and line of credit rates which slowed the recovery. It is too soon to say that the bank is again headed off on a premature line of interest rate rises as it made clear in its announcement that further rate rises might not occur ending upon conditions. But it would have been better not to have raised the rate at this point when there was still so much slack in the economy and no threat of inflation. the rate fell in lockstep with the fall in the American rates. As of May 2018 the rate was 5.2 % in Canada and 3.9% in the U.S.
But growth is much slower in Europe while improving in the U.S. Growth in China was still strong at 11.9 % in the first quarter of 2010 but slowing and Japan was still experiencing slow growth and deflation.(See tables 1 & 2 below)
Nervous behaviour will continue and unfortunately the decision of the OECD in May of this past year to urge governments to cut their deficits and begin to raise interest rates based on faulty monetarist logic is bound to have a negative effect upon growth thereby feeding back into a volatile market. This IMF OECD policy thrust has been confirmed by the G20 meeting in Toronto. Anti-Keynesian deficit hysteria has reappeared after its temporary banishment immediately following the crash in 2008.
This pessimism is because the market correctly assumes using Keynesian logic as opposed to new classical supply side doctrine that cutbacks in government spending in search of illusory premature budget balance will contract aggregate demand and slow the economy. The new classical position appears to argue that cuts to spending implies deficit reduction and sends the right signal to the bond market and to corporate investors. The cuts are thus thought to presage a new wave of investment. But the strategy is flawed in that it ignores the problem of consumer confidence, the question of aggregate demand and the rather strong possibility that the market acts on Keynesian impulses as much , if not more, than on new classical impulses.
The recent emergency conservative-Liberal Democrat budget released by the new Chancellor Gordon Osborne is an excellent case in point. This budget projects British unemployment as increasing on account of the austerity budget yet it proposes substantial and even draconian cuts and damaging tax increases. The budget is resolutely anti-Keynesian and the former Chancellor of the Exchequer in the John Major Tory government Kenneth Clarke has warned that the British middle classes have yet to feel the true impact of these cuts. The former Labour government now in opposition is strongly attacking the budget on Keynesian grounds, although they had planned more modest cuts of their own had they won the election.
Canadian Prime Minister Stephen Harper unfortunately has praised the U.K.budget as setting Britain on the right track. The most recent GDP data showed a contraction of 0.5 % for the last quarter of 2010.(The British Office of National Statistics) I expect more of this to come.
Unfortunately, the 2010 G20 meetings in Toronto opted to endorse a statement which committed countries to reduce their deficits by 50 % by 2013 and stabilize or reduce their debt to GDP ratios by 2016. The statement is fairly open ended, has no penalties for non compliance and permits countries to vary their policies to fit their circumstances but the fact that it was raised on the agenda by Canada and backed by many European countries and eventually, once modified, agreed to by the Obama administration is a sign of the tenacity of the fiscal conservatives and the lobbying power of the bond market traders. The markets in the short run reacted by lowering their expectations of growth and profits and selling stock and bidding up the price of bonds.
On Wall Street all of the leading major investment banks in 2008 have either failed, like Lehman brothers, been bailed out by the government with TARP money like Goldman Sachs or by major competitors with the help of government money, like Bear Stearns by J.P.Morgan ; Morgan Stanley by Mitsubishi UFI or Merrill Lynch by Bank of America.(See Paulson for details) The Federal Reserve has pumped several trillions of dollars into the economy.
Similar events have taken place in Great Britain, Germany, Spain, Belgium, Netherlands, Iceland, Dubai and France. Two of the world’s largest automotive companies G.M. and Chrysler have gone bankrupt and been successfully restructured with government money. A number of others are undergoing restructuring. The AIG insurance company, the largest insurance company in the world has been taken over by the U.S.government and bailed out of bankruptcy with loans that totalled more than 100 billion dollars. The two U.S.Government enterprises tasked with provided mortgage funds to the banks and homeowners, Fannie Mae and Freddie Mac were also both taken over by the government. (Paulson) they received a total of 131 billion dollars and as of January 2011 they still owe 73 billion. (President’s budget 2012)
A number of the companies received government aid in order to keep them operating. As the economy has recovered much of the loan money advanced has been repaid . It is now estimated that the final net cost of the TARP bailouts will be smaller than 30 billion.(See U.S. treasury department monthly report on TARP)(In fact as of 2017 TARP has made a $25 billion surplus for the U.S. government as the banks have repaid the loans with interest and the government has solid the shares back to private investors and the banks.) However,the laissez-faire myth of totally private enterprise operating without state aid lies shattered by recent events. As well, as Ormerod , Stiglitz,Krugman,James Galbraith, myself and other Keynesians, post-Keynesians and progressive economists have pointed out these events have shattered the claims of the rational agents rational expectations theorists (RARE macrotheorists) and real business cycle theorists about the inherent rationality of markets.
Ormerod shows how an even more extreme idealization of these models appeared as late as 2008 called dynamic stochastic general equilibrium models which macrotheorists believed contained the cutting edge of insight into the general equilibrium nature of the macroeconomy. Only months later, the collapse of Bear Stearns followed and the collapse of the Wall street investment banks was underway. Hegel’s owl once again took flight at dusk !
Many small and large banks have failed, and millions of people have lost their jobs. There are as of January 2011, 46.167 million unemployed in thirty OECD countries. The unemployment rate stands at 8.5 % for these countries with youth unemployment above 19 %.
Table 1.1
Unemployment rates in selected OECD countries and trade and currency associations as of April 2010 (except where noted) and December 2010 or where noted January 2011.
Table One:
Unemployment rates selected OECD countries April 2010 and December 2010 (except where noted)
|
Country
|
April 2010
|
|
December 2011
|
|
|
Spain
|
19.7 %
|
|
20.2 %
|
|
|
Slovakia
|
14.1
|
|
14.5
|
|
|
Ireland
|
13.2
|
|
13.5
|
|
|
Portugal
|
10.8
|
|
10.9
|
|
|
France
|
10.1
|
|
9.7
|
|
|
U.S.
|
9.7
|
|
9.0 (Jan.2011)
|
|
|
Sweden
|
9.1
|
|
7.8
|
|
|
Italy
|
8.9
|
|
8.6
|
|
|
Canada
|
8.1
|
|
7.8 (Jan.2011)
|
|
|
Germany
|
7.1
|
|
6.6
|
|
|
G7
|
8.4
|
|
8.0
|
|
|
E.U.
|
9.7
|
|
9.6
|
|
|
Eurozone
|
10.1
|
|
10.0
|
|
|
Japan
|
5.2
|
|
5.0
|
|
|
Netherlands
|
4.1
|
|
4.3
|
|
|
Norway
|
3.5
|
|
3.6
|
|
|
South Korea
|
3.2
|
|
3.7
|
|
|
China
|
|
|
4.3 (urban rate)
|
|
|
Belgium
|
8.4
|
|
8.1
|
|
Source: Eurostat;OECD;U.S.Bureau of Labour Statistics and Statistics Canada.
The return of deficit hysteria
The deep recession has been a global phenomenon stretching from Russia to China to Japan to North America to Europe . Africa and Latin America have been affected. The European union has been going through an ideologically engineered crisis over the levels of debt taken on by its member states, even though a rise in state indebtedness to finance stimulus is a sound Keynesian policy. Furthermore, in a number of countries the level of debt to the GDP is well below historical maxima and in the case of the U.K even below levels reached during the early 1970s.( Haroldchorneypoliticaleconomist, ‘’U.K. National Debt to GDP, 1916 to 1998, ‘’April 21, 2010; and ‘’ Spain, Debt and the Chicken Little squad, May 29, 2010 ; and OECD cited in Rudiger Dornbusch, Dollars, Debts and deficits, p.172, Table lll.2)Greece , Portugal , Ireland and Spain, the so called PIGS have been at the centre of this crisis.
Austerity has been imposed upon Greece in return for it obtaining the support of the European Central Bank (ECB), the European Union and the IMF. Again this is a very unfortunate tendency since unemployment is elevated in each of these countries with Spain in the worst shape suffering from close to 20 % unemployment, up from 10 % in 2006.( Eurostat; FT)
The new Conservative /Liberal coalition government of Great Britain has foolishly declared war on its deficit, despite its net debt to GDP ratio being a bit less than 60 %, a fifth of what it was at the end of the second world war. Indeed, the significant deficit which Gordon Brown the Labour P.M. had undertaken in response to the crisis was a factor in his defeat in the election. The new government intends to slash government expenditures by as much as 6 billion pounds in 2010 and by as much as 40 million pounds over the next four years. ( The U.K. budget, June 22, 2010;F.T.various issues May 2010;See also my letter to the F.T. April 26 , 2010 on British debt in historical perspective and the British office for national statistics) Global trade has been negatively affected.
Over the years that I have researched the question of the national debt and its impact upon an economy I have always been astonished at how boldly politicians, journalists and others ignore the lessons of historical experience.
For example, during the great depression of the 1930s one of the principal barriers to the relaunching of the British and North American economies was the obsession in balancing the budget despite the hardship that this act imposed and despite the negative consequences for the economy and the unemployed.In my writings I have drawn upon historical statistics to show that debt to GDP ratios were much higher than the levels reached in recent years and yet despite this the economies recovered and prosperity was restored and the debt ratio eventually dropped.
This was brought about through rapid economic growth and a sharp decline in the rates of unemployment. The notion that economic growth, wealth creation and prosperity are not incompatible with high debt to GDP ratios is crystal clear from the British case. The economic historian James Macdonald in his excellent work A free nation deep in debt makes exactly this point on pages 354-355.
He displays a chart which runs debt as a percentage of the GDP for Great Britain from 1690 to 1910. The ratio begins at 0% in 1690 runs higher and higher in a lurching manner until it peaks at about 300 % of the GDP in the late 1820s and then consistently declines with several brief upticks until it closes at around 20 % in 1910.As Macdonald states the debt was never lower than 100 % of the GDP for the century between 1760 and 1860 and averaged above 150 % from 1780 to 1845. “Simplistic notions that national power and national debt are mutually incompatible are disproved by this single historical fact.” (p.355)
For it was during this period that Britain became the leading industrial power in the West. Similarly in the twentieth century the British debt to GDP ratio rose to above 200 % and despite this Britain remained an important industrial power with a very high standard of living.
If one scans publications like the Wall Street Journal, the Financial Times, The New York Times, The Guardian, Le Monde and The Globe and Mail there is a growing sense of the enormous size of the crisis that we are passing through and the widespread shock about the level of destruction of financial assets and the wiping out of stockholder value that occurred. It appears that we have saved ourselves from another great depression,but only just, and that prospect was widely being discussed over the past 24 months. For a while the discussion was focused on the risk of a double dip recession. (See the pessimistic analysis of Nouriel Roubini in his RGE monitor for this perspective.) However, as growth has persisted in the American economy and the unemployment rate while still elevated has begun to fall the focus has shifted to a cautious optimism about a recovery.
Growth has resumed in the U.S. which has now had three consecutive quarters of growth since the summer of 2009. Unemployment however remains at 9 % in the U.S. Growth in Canada has also been positive, but unemployment is still above 8 %.
TABLE 2: Annual Percentage Growth Rate in GDP By country 2006 to 2010
|
Country
|
2010
|
2009
|
2008
|
2007
|
|
U.S.A.
|
2.9
|
-2.6
|
0.0
|
1.9
|
|
Japan
|
3.5
|
-6.3
|
-1.2
|
2.4
|
|
China
|
11.9 |
9.1 |
12.75 |
|
|
South Korea
|
|
|
|
|
|
India
|
8.6
|
7.4
|
9.0
|
9.2
|
|
Taiwan
|
13.3
|
|
|
|
|
Belgium
|
2.0
|
-2.8
|
1.0
|
2.9
|
|
Czech Republic
|
2.4
|
-4.1
|
2.5
|
6.1
|
|
Denmark
|
2.3
|
-5.2
|
-1.1
|
1.6
|
|
Estonia
|
2.4
|
-13.9
|
-5.1
|
6.9
|
|
France
|
1.6
|
-2.6
|
0.2
|
2.4
|
|
Ireland
|
-0.2
|
-7.6
|
-3.5
|
5.6
|
|
Germany
|
3.6
|
-4.7
|
1.0
|
2.7
|
|
Iceland
|
0.7
|
-3.5
|
-6.8
|
1.0
|
|
Hungary
|
1.1
|
-6.7
|
0.8
|
0.8
|
|
Greece
|
-4.2
|
-2.3
|
1.3
|
4.3
|
|
Italy
|
1.1
|
-5.0
|
-1.3
|
1.5
|
|
United Kingdom
|
2.2
|
1.4
|
-4.9
|
-0.1
|
|
Finland
|
2.9
|
-8.2
|
0.9
|
5.3
|
|
Latvia
|
-0.4
|
-18.0
|
-4.2
|
10.0
|
|
Lithuania
|
0.4
|
-14.7
|
2.9
|
9.8
|
|
Netherlands
|
1.7
|
-3.9
|
1.9
|
3.9
|
|
Austria
|
2.0
|
-3.9
|
2.2
|
3.7
|
|
Netherlands
|
1.7
|
-3.9
|
1.9
|
3.9
|
|
Portugal
|
1.3
|
-2.5
|
0.0
|
2.4
|
|
Slovakia
|
4.1
|
-4.8
|
5.8
|
10.5
|
|
Sweden
|
4.8
|
-5.3
|
0.6
|
3.3
|
|
Norway
|
1.9
|
-1.4
|
0.8
|
2.7
|
|
Iceland
|
-3.5
|
-6.8
|
1.0
|
6.0
|
|
Canada
|
|
|
|
|
|
Poland
|
3.5
|
1.7
|
5.1
|
6.8
|
|
Switzerland
|
2.6
|
-1.9
|
1.9
|
3.6
|
|
Spain
|
-0.2
|
-3.7
|
0.9
|
3.6
|
|
EU 27
|
1.8
|
-4.2
|
0.5
|
3.0
|
|
Euro area
|
1.7
|
-4.1
|
0.4
|
2.8
|
|
|
|
|
|
Source: Eurostat; OECD, Statistics Canada.
TABLE 2
Annual or first quarter growth rates(where indicated *) in GDP 2010; annual rates of 2009 growth; 2008; 2007;
Q1/10 09 08 07
Or annual 2010
Canada 6.1 %* 0.4 2.7 2.7
U.S. 2.9 * -2.6 0.4 1.9
China 11.9 %* 9.1 12.75
Japan 0.8 % -5.2 -1.2 2.4
Taiwan 13.27 % *
India 8.6 % * 7.4 9.0 9.2
Germany 0.2 % -4.9 1.3 2.5
France 0.1 % -2.6 0.2 2.4
Italy 0.5 % -5.0 -1.3 1.5
U.K 0.3 -4.9 0.5 2.6
Spain 0.1 -3.6 0.9 3.6
Greece -0.8 -2.0 2.0 4.5
Belgium 0.3f -3.0 1.0 2.9
Denmark 0.4f -4.9 -0.9 1.7
Ireland -0.3f -7.1 -3.0 6.0
Czech 0.4f -4.1 2.5 6.1
Austria 0.3f -3.5 2.0 3.5
Finland 0.4f -7.8 1.2 4.9
Sweden 0.3f -5.1 0.4 3.3
Norway 0.4f -1.6 1.8 2.7
Switz. 0.4 -1.6 1.9 3.6
Euro zone 0.2 -4.1 0.6 2.8
EU 27 0.2 -4.2 0.7 2.9
Source: Eurostat; OECD.
f forecast for Q1,
* annualized basis
Monetarist economists like Alan Meltzer writing in the Wall Street journal (August 31, 2009 ‘’What Happened to the Depression ‘’)insisted as the recovery began to make its appearance that the data shows that this recession is more like that of 1973-75, rather than the great depression.
That may well turn out to be true in terms of duration and maximum unemployment rate, but not in terms of the scope of the financial collapse and subsequent panic. Also remember that is only after a massive intervention by governments around the world and the expenditure of several trillion dollars in stimulus funds and dramatically lowered interest rates for a prolonged period.(U.S. 787 billion$ plus Troubled assets relief program(TARP) 700 billion and Troubled assets loan facility(TALF) funds in the form of loans of 500 billion,UK 80 billion $,Germany 80 b $, France 60 b $. Japan 81 billion, China 586 billion) that the economy has partially recovered. Not all of the TARP and TALF funds were utilized but the initial enormous commitments were necessary to restore relative calm to the markets.
Over time much of these monies advanced as loans have been repaid with interest so that the final cost of the bailout will be much less than the headline figures initially announced. For example G.M. and many of the investment banks have repaid billions of dollars of loans with interest as of spring 2010. Critics like Joseph Stiglitz have pointed out that the repayments were smaller than they should have been given the risks that the government took on and that private market loans would have demanded and received a higher rate of return.
The degree of widespread financial panic, bank failure, scandal and Ponzi finance, and stock market collapse, the spike in oil prices, as well the pressure of the collapse in investment and consumption all have to be taken into account. All of this far exceeded the events of 1973-75, a period with which I am personally very familiar .
The fact that the recession has now technically ended is much more the consequence of the policies implemented to treat it, rather than as Meltzer argues , the self recuperative power of market forces. For it was the unregulated forces of the market that led to this mess in the first place.
It is useful to remember that the value of shares in the Dow Jones index fell by 47 % from September 1929 to November 1929.They ended the year at 65 % of their September value. They did not regain their 1929 value until the early 1950s.(Kindleberger, p.105) The S&P index fell to just 25% of its 1929 peak by 1932(Kindleberger, fig.8 p.120 )The prices of primary products fell by a third world wide. The GDP in the US fell from its 1929 high by 29 % from 1929 to 1932/33.The number of unemployed rose from 1.6 million in 1929 to 12.8 million by 1932/33.(R.A.Gordon , Business cycles,p.429) The slump in Britain and Canada was just as severe. For example, disposable income fell to 51 % of the 1929 level by 1933 in Canada. By 1933, 20 % of the work force was unemployed in Canada. (A.E.Safarian, The Canadian Economy in the Great Depression, p.86 &p75)
This time the slump in the stock market was initially even greater than in the first part of 1929. From their peak in August of 2007 until their low point in March of 2009 stocks fell from Dow 14141 to Dow 6600 a fall of about 53 %. But since the low point of last March they recovered to Dow 10800,in April 2010, a fall of about 23.6 % from their peak. The level as of June 28 was Dow 10,138. It has since risen to Dow 12,400.(Feb. 2011)
So talking about the possibility of a depression along these lines is a very serious proposition and given what governments know about how to avoid these problems it is still possible but unlikely. A serious prolonged period of high unemployment is however much more likely. This is particularly so because governments the world over are still obsessed with deficit hysteria. Growth has resumed but the unemployment rate is dropping very slowly. This is often the case after a major downturn. Paul Krugman in the New York Times has been very pessimistic about the prospects for a depression, particularly since the G20 countries have rather foolishly adopted a commitment to cut deficits in half by 2013 and stabilize or reduce debt to GDP ratios by 2016.
It never ceases to amaze me how often I need to repeat certain statistical facts about the state of deficits and debt in the U.S. and elsewhere because of the headline hysteria in the press(even the quality financial press) about the supposed disasterous state of U.S. finances. So here goes again.It is necessary to place the data in historical perspective. The American deficit as a percentage of the GDP was 0.6 % of the GDP in 1930. It then rose steadily until it reached 5.9 % of the GDP in 1934. In 1935 it was 4 %; the years that followed saw the deficit rise then fall then rise enormously.
1936 5.5 %;
1937 2.5 %;
1938 0.1 %;
1939 3.2 %
1940 3.0 %
1941 4.3 %
1942 14.2 %
1943 30.3 %
1944 22.7 %
1945 21.5 %
1946 7.2 %
1947 (1.7 %) a surplus and in surplus until 1950.(All the data is from the Historical tables of the U.S.budget for the fiscal year 2008).
Now the hysteria: the deficit has risen because of the financial crisis, the huge rise in unemployment and possibly also because of certain tax expenditures such as cutting the taxes of the wealthiest taxpayers. It reached 10 % of the GDP in 2009; 8.9 % in 2010 and is projected to hit 9.8 %in 2011.the latest budget of ther President estimates that the deficit will rise to 1.6 trillion dollars in 2012 ?(double check this)
The U.S. in 1943 was a much poorer country in terms of real GDP per capita than now and yet it sustained a deficit that was in terms of percentage of the GDP more than three times as large. In fact, once full employment was restored the U.S .economy underwent a prolonged period of growth and prosperity that followed the end of the war.
I sympathize with Paul Krugman’s frustration over the widespread ignorance among politicians of economic history and their apparent rush to repeat the errors of history. But given the rather open ended language of the commitment and the recognition that each country will have to deal with their own circumstances it is possible we will be lucky and deficit reduction approaching these targets will take place largely because of the resumption of growth. Nevertheless, the risk of depression is in fact strengthened by austerity policies at such a critical point in a fragile limited recovery. It is a very bad reality that the U.S.congress is now apparently opposed to further stimulus measures and that fiscal conservatives dominate governments throughout most of the G20. The latest budget proposal of President Barack Obama proposes small but significant cuts to spending over the next few years including cuts to subsidies for poor families to help pay their heating bills and eliminating some programs that help poorer families with university tuition. But as bad as these are they pale in comparison with what the Republicans appear to be proposing. Unfortunately, the focus has shifted from stimulus to budget cutting because of the shift in political representation in the house. We shall see if the forces promoting recovery are strong enough to sustain the momentum or if these cuts will alter the momentum in a negative fashion. There is still a deficit of substantial size, interest rates are still low but the size of the deficit is being reduced and it may be that the full employment budget is in surplus which will send a contractionary signal to the economy. The cuts in spending that are proposed will occur when unemployment is still elevated above its low point in the cycle.
Typically it takes two or more years after the end of a recession for the unemployment rate to drop substantially. Sometimes a full 4 or 5 years after the end of the recession the rate is still higher than what it was just prior to the recession. For example, in the U.S. after unemployment rose in 1990 from its low of 5.2 % it took more than five years for the rate to drop to this level again.( See the U.S. Bureau of Economic analysis historical statistics)
In the summer of 2009, the first signs of the beginning of an economic recovery made their appearance. Positive growth appeared in both the U.S. and Canadian economy in the third and fourth quarter of 2009.This means that the recession in Canada was technically 10 months long while the one in the US was 18 months in duration. The European recession appears to have begun in the 2nd quarter of 2008 and may have ended in the third quarter of 2009. Although the formal recession in terms of positive GDP growth may have ended, unemployment continued to rise in both Canada and the U.S. and in Europe. The rate for August 2009 rose to 8.7 % in Canada and to 9.7 % in the U.S. The U.S. rate then peaked at 10 % in the U.S. and has now declined to 9.0 % while the Canadian rate peaked at 8.7 % but has now fallen to 7.8 %(Jan.2011) .
The rate in the fall of 2009 in France was 9.8 % , Germany 7.7 %,the U.K. 7.7 %,7.0 % in Belgium, 18.5 %in Spain, 9.2 % in Sweden, 5.7 % in Japan. )
By November 2009 the rates were 7.5 % in Germany, 10 % in France, 8.1% in Belgium, 19.4 % in Spain, 9.7 % in Greece, 8.7 % in Sweden, 13.5% in Ireland. The rate in Greece has since risen to 10.3 %.
By January 2011 the rate had worsened in some countries and improved somewhat in a number. (See Table one)
The overall rate for the euro area in January 2010 was 9.9 % and for the European union 9.7 %. In January 2010 the rate was: Belgium 8.0%,; France 10.1 %; Germany 7.5 %; U.K. 7.8 %; Spain 18.8 %; Sweden 9.1 %; Italy 8.6 %; Ireland 13.8 %; Greece 9.7 % (Sept.2009) now Feb 2010 10.3 %;Luxembourg 5.9 %; Norway 3.3 %; Netherlands 4.2 %; Denmark 7.3 %; Japan 4.9 %; Poland 8.9 %; Czech republic 8.2 %; Slovakia 13.7 % ; Canada 8.2 %(Feb.2010) and the U.S. 9.7 %(Feb.2010).
Net job losses continued in the U.S. during the summer with August showing a net loss of over 200,000 jobs, the lowest number in many months but still a large number. In Canada in August largely because of part time employment rises there were net job gains even as the rate rose because of discouraged workers rejoining the labour force. The broader measure of unemployment that includes all marginally attached and discouraged workers and those working part-time when they would rather be working full time rose to 16.8 % in the U.S. in August up from 10.7 % in August 2008. Since the start of the recession the U.S. has lost over 7.1 million jobs. (U.S. Bureau of Labour Statistics, Statistics Canada, labour force survey)
This has improved in both Canada and the U.S. with the latest data showing that in February the U.S. lost only 22,000 jobs.
At present however there are close to 15 million people unemployed in the U.S. and another 21 million unemployed in Europe.(U.S. Bureau of labour statistics; Eurostat)The total level on non farm U.S. payroll employment has fallen from its peak in January 2008 of 137,996,000 to its low of 129,246,000 –a drop of over 8.7 million workers in Feb. 2010 to its current level as of January , 2011 of 130,265,000. There is still a very steep climb left to travel to restore American and global employment back to its pre-recession position.
So it is against this backdrop that we must consider and evaluate the policy options chosen by governments throughout the world to battle the steep slump and reserve the tide of pessimism and fear. Among these options were deliberate public sector deficits which dramatically increased state expenditures on employment generating projects including substantial infrastructure investment and programs designed to replace lost incomes and stimulate consumption as well as improve the environment. Dramatic though these increases were the deficits that resulted were still moderate in comparison with the level of deficit spending that prevailed during the second world war.
The origins of quantitative easing
In September 2008 I wrote in my internet blog(Haroldchorneypoliticaleconomist.piczo.com) and in comments posted in The Wall Street Journal, the Financial Times, The New York Times and in The Globe and Mail that the crash in the financial markets and the accompanying paralysis of the financial system was grave enough to warrant drastic action. I called for large deficit spending and zero interest rates as well as central bank intervention through quantitative easing to keep the rates as low as possible. The governments and central banks did exactly that. Many economists urged what I urged on the fiscal policy front and also on the conventional monetary policy front. But very few also urged quantitative easing, a policy that I had first explored and advocated as far back as 1983.
This notion of quantitative easing which is essentially temporary greater monetization of a portion of the government’ debt than is normally the case, is facilitated by the central bank purchasing treasuries directly in the money markets to prevent any crowding out from occurring. It is a policy idea that I first presented in Canada back in the 1980s and 1990s in a series of published works in edited collections, monographs and journals. As far as I know I was one of the first, if not the first economist in the modern era to advocate this policy. (Harold Chorney, The Deficit:Hysteria and the Current Crisis, Ottawa: The Canadian Centre for Policy Alternatives, 1984 reprinted with a new preface in Harold Chorney& Phillip Hansen,Toward a Humanist Political Economy.
Harold Chorney, The Economic and Political Consequences of Canadian Monetarism, paper presented to the British Association of Canadian Studies, University of Nottingham, April 12, 1991 forthcoming in On stimulus, deficits and surpluses.
Harold Chorney, The Deficit and Debt Management: an Alternative to Monetarism, Ottawa: The Canadian Centre for Policy Alternatives, 1989.
Harold Chorney, ‘’A Regional Approach to Monetary and Fiscal Policy’’ in J. McCrorie and M.Macdonald, The Constitutional Future of the Prairie and Atlantic Regions of Canada, Regina; Canadian Plains Research Centre, University of Regina, 1992.
Harold Chorney, Debts, Deficits and Full Employment in Robert Boyer and Daniel Drache, States Against Markets:The Limits of Globalization, New York& London: 1996.)
I made the argument that temporarily monetizing a greater portion of the debt would keep interest rates lower and accelerate the recovery after a recession. I first wrote about it as follows during the recession of 1981-1983.
Contemporary conservative economists argue that the deficit causes high interest rates. Actually this theory and the concept of ‘crowding out” that it has spawned were also circulated during the Great Depression of the 1930s. Like many of the myths that surround the issue of deficits, it is an old notion. During the 1930s many economists and businessmen believed financing government deficits by borrowing would displace or ‘’crowd out” private investment projects by pushing up the rate of interest.
This argument misrepresents how interest rates are established. In fact, the Bank of Canada can exercise considerable influence over interest rates through its ‘open market operations.’ These operations refer to the buying and selling of bonds and Treasury bills. Some economists argue that reducing interest rates in this way will lead to inflation. In fact, as I have explained above, the theory depends upon a number
of assumptions that may not hold. Furthermore inflation is currently not the problem, however, unconscionable excessive unemployment is. It is certainly not beyond the Bank of Canada’s capacity to pursue a less rigid monetary policy in order to lower interest rates. Also, such a policy of monetizing more of the debt than it now does need not last indefinitely. Rather, it is a temporary measure to ensure that the deficits have the opportunity to stimulate economic recovery and a greater supply of savings to retire the debt further down the road as the economy recovers and the deficit declines. Thus the timing, as well as the actual financing policy used by the Bank is of importance in managing the debt. Other things being equal, if the central bank allows a sufficient time during which it monetized a certain portion of the debt before turning to the money markets to reduce the monetized portion through borrowings it will both reduce interest payments and unemployment. (Harold Chorney, The Deficit :Hysteria and the current crisis, published in 1984 Canadian Centre for Policy Alternatives republished in Toward a Humanist Political Economy, 1992, p.128. I also presented these arguments before several conferences of academic and business economists during this period and also presented these ideas in broad popular form to the media in Canada.)
Like all good ideas it had been discussed in history before.
It is useful to know that Keynes himself approved of this approach. In March of 1930 before the Macmillan Committee in the U.K. of which Keynes was both a member and also a major witness he argued in favour of this policy as follows.
”My remedy in the event of the obstinate persistence of a slump would consist, therefore, in the purchase of securities by the Central Bank until the long term market-rate of interest has been brought down to the limiting point….(with respect to the 1930s slump) the Bank of England and the Federal Reserve Board (should) put pressure on their member banks…to reduce the rate of interest which they allow to depositors to a very low figure, say 1/2 per cent…(and) these two central institutions should pursue bank-rate policy and open market operations à outrance.”
(See Report of the Committee on Finance and Industry (Macmillan report), 1931 Vol II, p.386. cited in Benjamin Higgins,” Keynesian Economics and Public Investment policy” in Seymour Harris,ed. The New Economics, Keynes’ Influence on theory and public policy, N.Y.:Alfred A.Knopf, 1948, p.470 note 9.See also Peter Clarke, The Keynesian revolution in the making 1924 – 1936, Oxford:the Claredon Press, 1988.pp.150ff )
Later in the General Theory he developed his ideas of fiscal stimulus further and appeared to give more emphasis to fiscal policy in the context of a multiplier enhanced stimulus. But monetary policy was always an important part of his tool kit and it should remain part of ours. Michal Kalecki also wrote about excercising monetary policy in such a way as to keep interest rates low and supportive of recovery whatever the tendency of the bond market. What he had in mind was a form of quantitative easing.
Michal Kalecki, the Polish Jewish economist who in many ways is a co-discoverer of the economic insights associated with John Maynard Keynes in an essay published in a collection The Economics of Full Employment in 1944 by the Oxford University Institute of Statistics published by Basil Blackwell also wrote briefly about what has come to be known as quantitative easing. Kalecki’s essay was called Three ways to full employment. In his discussion of deficit financing he posed the question of where does the money come from to finance deficit spending and how do we prevent the interest rate from rising so much so as to reduce private investment by an amount which offsets the stimulating effect of government expenditures(the so called treasury view which these days is known as crowding out).
With respect to where does the money come from Kalecki shows that the budget deficit plus gross private investment equals gross savings since in a closed economy national expenditure equals national income plus tax revenues. Once depreciation is deducted from both sides we have net savings equal to the budget deficit plus net investment. He concludes ”whatever the level of prices, wages or rates of interest, any level of private investment and budget deficit will always produce an equal amount of saving to finance these two items.”(p.41)
He then goes on to discuss the problem of crowding out. He argues that the rate of interest can be maintained at a stable level however large the Budget deficit provided an appropriate banking policy is followed by the central bank. If the public prefer to invest their savings in bank deposits and they as well as the banks do not buy government securities in the requisite amounts to keep interest rates from increasing this could result in interest rates rising. However, if the central Bank expands the cash basis of the banks by purchasing debt instruments ”no tendency for a rise in the rate of interest will appear.” (p.43) He concludes:
”provided the central bank expands the cash basis of the private banks according to the demand for bank deposits, and that the Government issues long and medium term bonds on tap, both the short term and long term rates of interest may be stabilized whatever the rate of the Budget deficit.”(p.42)
Abba Lerner somewhat later also wrote about these issues in his work on functional finance.
So the roots of what is now called quantitative easing lie in the Keynesian Kaleckian monetary and fiscal theory debates of the 1930s and 1940s with a special place also allocated to the Japanese finance minister Korekiyo Takahashi in the early 1930s. Kindleberger shows that Takahashi was already familiar with Keynes’ work and his advocacy of deficit finance and the role of the multiplier by the early 1930s. His use of quantitative easing followed logically from this knowledge.(See Charles Kindleberger, The World in depression 1929-1939, p.163) C
Takahashi 1854-1936 was finance minister of Japan on 7 occasions from 1913 to 1936.( Dick Nanto &Shinto Tagaki, Korekiyo Takahashi, Japan’s recovery from the Great Depression, American Economic Review: Papers and proceedings of the 97th annual meeting of AEA, May 1985 pp.369-374 most of the following is derived from this paper) He had also served on the board of the Bank of Japan which he joined in 1892. He became its governor in 1911.He was called back from retirement to take over the Finance portfolio after the financial panic of 1927 and the restoration of the gold standard at too high an exchange rate to the Yen caused a steep downturn. He immediately abandoned contractionary policies and followed a policy centred on stimulus, promotion of exports,mercantilist restraint of imports, low interest rates and the financing of substantial deficit spending through the sale of bonds to the Bank of Japan which were later resold to the public. Hence his identification with what has become to be known as quantitative easing. The Japanese economy recovered rapidly from the effects of depression.Takahashi, according to Nanto and Tagaki believed there were certain limits to the public’s capacity to absorb the sale of debt even after making substantial use of the Bank of Japan to temporarily hold the debt. So in 1936 he began to limit military expenditures as part of a debt restraint policy. This then led tragically to his assassination by Japanese militarists.
It was my knowledge of these discussions and debates in Keynesian circles in the 1920s and thirties and forties which inspired me to write about these policy options in the 1980s and early 1990s when I presented these ideas in articles, monographs and debates about financing the deficit in Canada during that period. At that time initially I had little knowledge of the role played by Takahashi but I knew that it was perfectly consistent with Keynes to work to keep interest rates as low as possible and run what was called an accommodating monetary policy.
I explored the argument of the monetarists that monetizing debt was always inflationary and found that it was not always so depending upon the circumstances. I constructed a forty year time series of the ratio of monetized debt to the broadly defined money stock and compared it to the rate of inflation over the same time period. There was no correlation. There were periods when inflation was high but the ratio of monetized debt to M2 very small and periods when the ratio of monetized debt to M2 very high, yet no inflation. Clearly inflation as a phenomenon is due to other influences than the ratio of monetized debt as a proportion of the money supply. This means and this was the conclusion that I drew the central bank has a powerful tool with which to influence interest rates to support an economic recovery. It can temporarily buy government debt to push the rate of interest lower and prevent financial crowding out. The time series is reproduced below in Table 3.
Table 3:
Monetized government Debt as a percentage of the broadly defined money supply and the rate of inflation Canada 1950 to 1989.
|
YEAR
|
Percentage
|
Rate of inflation
|
|
1989
|
7.5
|
3.6
|
|
1988
|
8.3
|
4.0
|
|
1987
|
9.1
|
4.5
|
|
1986
|
8.7
|
2.9
|
|
1985
|
8.3
|
3.2
|
|
1984
|
9.6
|
3.5
|
|
1983
|
9.8
|
5.4
|
|
1982
|
8.8
|
10.4
|
|
1981
|
10.1
|
10.6
|
|
1980
|
10.9
|
11.4
|
|
1979
|
10.3
|
10.3
|
|
1978
|
10.6
|
6.4
|
|
1977
|
10.7
|
7.0
|
|
1976
|
9.9
|
9.5
|
|
1975
|
11.1
|
10.7
|
|
1974
|
11.6
|
15.3
|
|
1973
|
12.0
|
9.1
|
|
1972
|
12.7
|
5.0
|
|
1971
|
13.0
|
3.2
|
|
1970
|
13.6
|
4.6
|
|
1969
|
14.3
|
1.1
|
|
1968
|
14.4
|
3.3
|
|
1967
|
15.8
|
4.0
|
|
1966
|
16.4
|
4.4
|
|
1965
|
17.5
|
3.3
|
|
1964
|
17.6
|
2.4
|
|
1963
|
18.6
|
1.9
|
|
1962
|
19.2
|
1.4
|
|
1961
|
19.4
|
0.4
|
|
1960
|
19.7
|
1.3
|
|
1959
|
20.3
|
2.0
|
|
1958
|
20.2
|
1.5
|
|
1957
|
20.6
|
2.1
|
|
1956
|
21.5
|
3.7
|
|
1955
|
21.2
|
0.6
|
|
1954
|
22.0
|
1.6
|
|
1953
|
23.7
|
0.2
|
|
1952
|
23.9
|
4.4
|
|
1951
|
25.0
|
11.3
|
|
1950
|
22.9
|
2.4
|
|
|
|
|
|
|
Source: Calculated from the Bank of Canada Monthly Review and the Canadian Department of Finance Quarterly and Annual reviews 1950 to 1989. The table first appears in Harold Chorney ‘’A Regional Approach to Monetary and Fiscal Policy’’ in J.McCrorie and M.Macdonald, The constitutional future of the Prairie and Atlantic Regions of Canada, Canadian Plains Research Centre, University of Regina, 1992. It is also discussed and reproduced in Harold Chorney ‘Debts, Deficits and Full Employment’’ in D.Drache and R.Boyer, States against Markets:The Limits of Globalization, Routledge, 1996 and the approach as a policy tool in The Deficit:Hysteria and the Current Crisis, The Canadian Centre for Policy Alternatives, Ottawa: 1984, which is largely reproduced in my collection of essays with P.Hansen, Toward A Humanist Political Economy, Montréal&N.Y. Black Rose Press,1992.
My colleagues the late John Hotson of Waterloo and Mario Seccareccia of the Université d’Ottawa also co-authored one of the publications, a pamphlet which sought to popularize the argument entitled The Deficit Made Me Do It.
The early 1930s Japanese finance minister Korekiyo Takahashi who was influenced by Keynes introduced this approach in Japan. There was also a foreshadowing of it in the Glass Steagall act of Feb.27, 1932. The act on an emergency basis permitted the U.S.Fed ‘’to count government securities together with eligible commercial paper as reserves against the system’s liabilities.’’
As Friedman and Schwartz point out this meant that government debt could now be counted as part of the 60 % collateral other than gold required against federal Reserve notes.(Milton Friedman& Anna Jacobson Schwartz, A Monetary History of the United States, 1857-1960 , p.191. and Charles Kindleberger, The World in Depression, 1929-1939, p.183) This then led to a very large open market purchase of government issued debt by the Fed , despite substantial internal opposition on the grounds that the action would be inflationary.
Allan Meltzer points out that in 1932 there was heated debate about the Fed buying U.S. treasuries as part of its effort to rescue the economy from the depression. Previous to this debate and the decision to actually acquire treasury debt as part of a strategy of quantitative easing the Fed largely restricted itself to the real bills doctrine about which debt instruments the Fed should acquire in conducting monetary policy.
Meltzer shows that this debate also occurred in Great Britain in the nineteenth century when there was a need for the Bank of England to purchase treasuries in the open market. (Meltzer, A History, p.37) To a certain extent the debate between the currency school and the banking school turned on these issues of which debt instruments it would be legitimate for the central bank to purchase and hold. (Meltzer, p.43)
In the twentieth century the issue of the central bank buying treasuries re-emerged during the financing of the first world war and there was a clear bias in favour of the real bills doctrine. But Meltzer points out that ‘’Most commentators point out(correctly) that it is no more inflationary for the Federal Reserve to buy the bonds directly(or in the open market) than to lend the money to the banks at below market rates so that banks can either purchase the bonds or finance the public’s purchases. The increase in the monetary base is the same. (p.87) Nevertheless, during the 1920s right up until the crash of 1929, monetary policy was dominated by a doctrine called the Riefler-Burgess doctrine which was compatible with the conservative real bills doctrine and was very restrictive in terms of what it regarded as legitimate central bank purchases.. Winfield Riefler and W. Randolph Burgess were the two banking economists who developed the doctrine and Meltzer draws upon his research with Karl Brunner in describing the significance of their work. (p.161)
It was not until the passage of the Glass Steagall act in 1932 that more flexibility was introduced which permitted the Fed to substitute government paper for commercial paper or real bills . (Meltzer, p.357) During the spring of that year the Fed acquired over 654 million dollars of government securities. The rate of purchase was over 100 million a week.
But this first use of quantitative easing was a very limited experiment which ended by August of 1932.(p.358 ff) At the time there was no obvious immediate positive response in the economy and the general conservatism of central bankers, economists and business people was enough to halt the program. Once Roosevelt replaced Herbert Hoover and Mariner Eccles became the chairman of the Fed and Lauchlin Currie one of Roosevelt’s principal economic advisers other possibilities developed. Harry Hopkins also played a major role.
Initially, of course, Roosevelt had campaigned on balancing the books. But once he was in office he gradually realized how a bad a policy that would be. Under the influence of Eccles and Currie and the real circumstances of the depression he came to support deficit spending and work creation relief programs. Meltzer draws extensively on Currie’s and Eccles’ writings and speeches . He also uses a work by R. Sandilands on Currie’s life and political economy and develops a very important profile of these extraordinary people. ‘’Eccles and Currie, separately, developed the idea of countercyclical fiscal policy that later became identified with Keynes’ General theory.
Eccles like Keynes wanted not just spending but government investment to replace private investment during recessions.’’ (p.420) Just to be clear, private investment declines during a recession. Indeed that is its hallmark and that is what causes the slump because of the operation of the accelerator and the investment multiplier.
Eccles believed that mal-distribution of income was responsible for the depression because first it promoted a speculative bubble and a productive capacity that far exceeded the effective demand that was possible given the distribution of income and wealth. He was a strong advocate of budgetary deficit spending and an accommodating monetary policy. But Meltzer points out that Eccles believed simply increasing the money supply and lowering rates would not work unless it was accompanied by major fiscal actions promoting investments through deficit finance. Meltzer traces the origins of the famous expression pushing on a string and the notion of the liquidity trap to both Eccles and one his supporters, congressman Alan Goldsborough in an exchange during Eccle’s testimony before the House committee on banking and finance in 1935.
Most critics of this policy of Keynesian stimulus and an accommodating monetary policy make dire warnings about the risk of inflation.
In fact, of course, the U.S. was experiencing exactly the opposite, deflation at the time. This was a definite change in central banking that was in fact a form of quantitative easing. In the past the fetish of the gold standard and the doctrine of real bills had dominated central bank thinking. (Real bills were notes, drafts and bills of exchange issued by banks on the basis of commercial transactions.)One would have had to go back to the civil war issuance of greenbacks, a purely fiat currency which largely financed the war to find non gold nor silver nor real bills backed currency. A number of otherwise conservative economists backed the decision of the central bank, pointing out the deflationary circumstances. Milton Friedman later complained that the Fed had not been expansionary enough.(see his discussion of the Glass –Steagall act of 1932., p.191 Milton Friedman and Anna Jacobson Schwartz, A Monetary History of the United States. But given the climate of opinion it is understandable. Just as today we have ferocious opposition to quantitative easing and deficits despite the clear necessity of these policies if we are to avoid the disaster of the 1930s.
The purchase of treasury debt to forestall interest rate rises thus became a normal part of monetary policy. It was strongly exercised during the 1940s and fifties in the U.K. (See R.Sayers Modern Banking, fifth edition, Oxford: Clarendon Press, 1960, p.136 ff and his discussion of the Chancellor of the Exchequer Hugh Dalton’s drive to lower interest rates in 1946-47. See also ch.8 on Commercial Bank liquidity and lending policy. Pp.157ff)
There has been a long history of debate with respect to the central bank and its power to exert influence over the whole range of interest rates from the short term where it clearly has absolute power, to longer portions of the yield curve where its powers are more ambiguous.
Abba Lerner had discussed important aspects of central bank authority in the 1940s in his work on functional finance. In Japan the Minister of Finance had resorted to this policy of quantitative easing in the 1930s. But for the most part this critical policy innovation had been forgotten by the high point of monetarism in the 1980s and the decades which followed.
When I first discussed it in the early 1980s I was ridiculed by Bank of Canada economists and called foolish for proposing such an ” inflationary” idea. Other critics claimed it was simply social credit theory, an idea associated with the funny money movement of the 1930s and the ideas of a British engineer Major Douglas. Indeed, when Abba Lerner first wrote his classic work on functional finance , a senior Canadian Dept. of Finance official A.N.McLeod claimed that it bordered on social credit or at least would be interpreted by them as supporting their argument and would cause inflation..( Memorandum for Mr. Bryce Re:My comments on Lerner’s ‘’Functional finance’’ RG File 04747-251 Finance Central files, Ottawa, April 24, 1944 ) Even my current editor, an historian by training has claimed that it was social credit.
It is in fact neither social credit nor automatically inflationary. Rather it represents a sophisticated approach to using both monetary and fiscal policy in fighting a slump and a collapse in confidence of which Keynes himself privately approved .(See David Colander,‘’Was Keynes a Keynesian or a Lernerian,’’ Journal of Economic Literature, Dec.1984, pp1572-1575 )
I explained then and am glad to see it has now been accepted that it need not be inflationary when the threat is deflation and depression. Rather, it becomes a very useful tool to ward off deflation and prolonged depression. I was , of course, pleased to see it embraced by most if not all of the central banks and the I.M.F. during 2009. The Japanese resorted to this policy when they sought recovery from the bursting of their real estate bubble. The Fed, the Bank of England and the Bank of Japan have all resorted to it during this period of crisis. Inflation , in the sense of price increases beyond three percent, for the time being is nowhere to be seen except in Britain. In the U.S. core inflation is still below 2 %.
Even the ultra conservative Bank of Canada considered using it as I have shown above. The European Central Bank initially refused to use it but during the Greek sovereign debt crisis they relented somewhat and as I have shown above they undertook a modest program unfortunately belatedly.
In response to the banking and credit panic and the severe slump that followed, liquidity needed to be injected by the central banks. Interest rates needed to be cut. Large budget deficits needed to be undertaken to finance infrastructure and investments that are labour intensive in education, health care, social policy, the military and the environment. The 787 billion dollar bailout rescue package passed by the American Congress in early October, 2008 ,the Economic Emergency Stabilization Act., was intended to stimulate the economy and create employment. To a certain extent it has succeeded but its success has been limited by the failure to spend the funds expeditiously and by bureaucratic problems with its administration. Only by the end of 2010 will the majority of the monies actually be expensed. It has also been undermined by simultaneous cutbacks by state and local governments. Chairman Ben Bernanke despite enormous conservative pressure from right wing republicans and media like the Wall Street journal who have warned of the dire consequences from an inflationary point of view of the policy enancted a second 600 billion dollar phase of quantitative easing designed to keep interest rates as low as possible and promoter economic recovery. The recovery has been slow on the employment front but gradually the economy appears to be recovering as month to month the numbers of people claiming unemployment benefits has fallen and since November the unemployment rate has also fallen reaching 9.0 % in January.
Perhaps even more importantly the broader measure of unemployment has fallen from 17 % to 16.1 %
Unfortunately, the earthquake and tsunami and nuclear reactor crisis in Japan and the rise in oil prices in response to events in North Africa and the middle East have introduced new elements of instability which will affect confidence in recovery somewhat in the coming months.
Thomas Kuhn in his classic work on The structure of scientific revolutions argues that in the sciences and we can argue about whether or not economics is a science as opposed to an art- paradigm shifts occur only after the dominant paradigm is discredited by counterfactual evidence sufficiently that researchers lose faith in the power of its fundamental argument and a new plausible paradigm emerges.
Kuhn explains the process as follows. for scientific retooling to take place and new paradigm developed to replace the old and now deficient paradigm a crisis must arise. ”Let us assume then that crises are a necessary precondition for the emergence of novel theories..once it has achieved the status of a paradigm a scientific theory is declared invalid only if an alternative candidate is available to take its place.”(p.770 A crisis can be resolved in one of three ways. One way is that normal science consistent with old paradigm reasserts itself and resolves doubts about the paradigm. A second way involves no satisfactory resolution and the issue is prolonged for the next generation of researchers to attempt to resolve it. The final way involves the emergence of a new candidate for paradigm and with the ensuing battle over its acceptance.” (p.8484)
This is the fate that befell neo-classical Keynesian doctrine during the OPEC cartel formation and stagflation period of the 1970s. It was an unfortunate turn of events because the neo-classical Keynesian model that was discredited was based on a hermeneutic misunderstanding of the original theory. Keynes’ subtle theory of the inflationary process which had explained the possibility of simultaneous inflation and unemployment and inflation as a consequence of disproportionalities , supply bottlenecks and the oligopoly power of price makers and wage push pressures from unions had been eclipsed by a more simplified linear model that seemed to suggest that inflation was more likely to be excess demand in nature. Nevertheless Keynesian was banished and replaced by Friedmanite monetarism as the dominant paradigm. This market and money driven paradigm over the years became increasingly dogmatically linked to market perfection theory and the new classical macroeconomics which in policy terms promoted deregulation, privatization and laissez-faire and shrinking the state as the preferred policies. This in turn has led us to the disaster of the 2007-8 bubble bursting and crash. It is my view that the old markets first paradigm is now discredited as a guide to policy and a revised Keynes inspired policy regime is now in the process of emerging exactly as Kuhn predicts.The coming months and years , notwithstanding the resurgence of the Republicans as a dominating force in Congress, will either confirm or erode this proposition.
Appendix:Federal debt at the end of the year 1940 to 2011, Budget of the President 2011.
U.S. Deficit:Summary of Receipts, outlays and surpluses or deficits at end of year 1930 to 2016. The following table is derived from this second table .
Table A:1
Receipts, outlays , deficits and surpluses 2010 and 2011 and projected 2014 in billions $
2010 2011 2014
Receipts 2163 2174
Outlays 3456 3819
Deficits 1293 1645
Debts held
By Public 9019 10856
Debts net of
Financial Assets 7894 9505
As % of GDP
Deficits 8.9 % 10.9%
Debt held by
Public 62.2% 72.0 % 76.3%
Debt net of assets
GDP 14,